
Dữ liệu phân bố kích thước hạt (PSD) từ máy xay không nên chỉ được tóm gọn bằng một con số trung vị duy nhất. Phần đuôi của phân bố — nơi chứa các hạt rất mịn hoặc rất thô — có thể mang thông tin quan trọng về hiệu suất chiết xuất mà một giá trị trung vị đơn lẻ không thể hiện được.
PSD phải được đọc như một phân bố
Một kết quả PSD đầy đủ là một đường cong hoặc bảng số mô tả phần trăm khối lượng hoặc số lượng hạt tại mỗi khoảng kích thước, không phải một điểm số duy nhất. Hai mẫu có cùng kích thước trung vị (X50) vẫn có thể có hình dạng phân bố khác nhau, dẫn đến hành vi chiết xuất khác nhau khi pha.
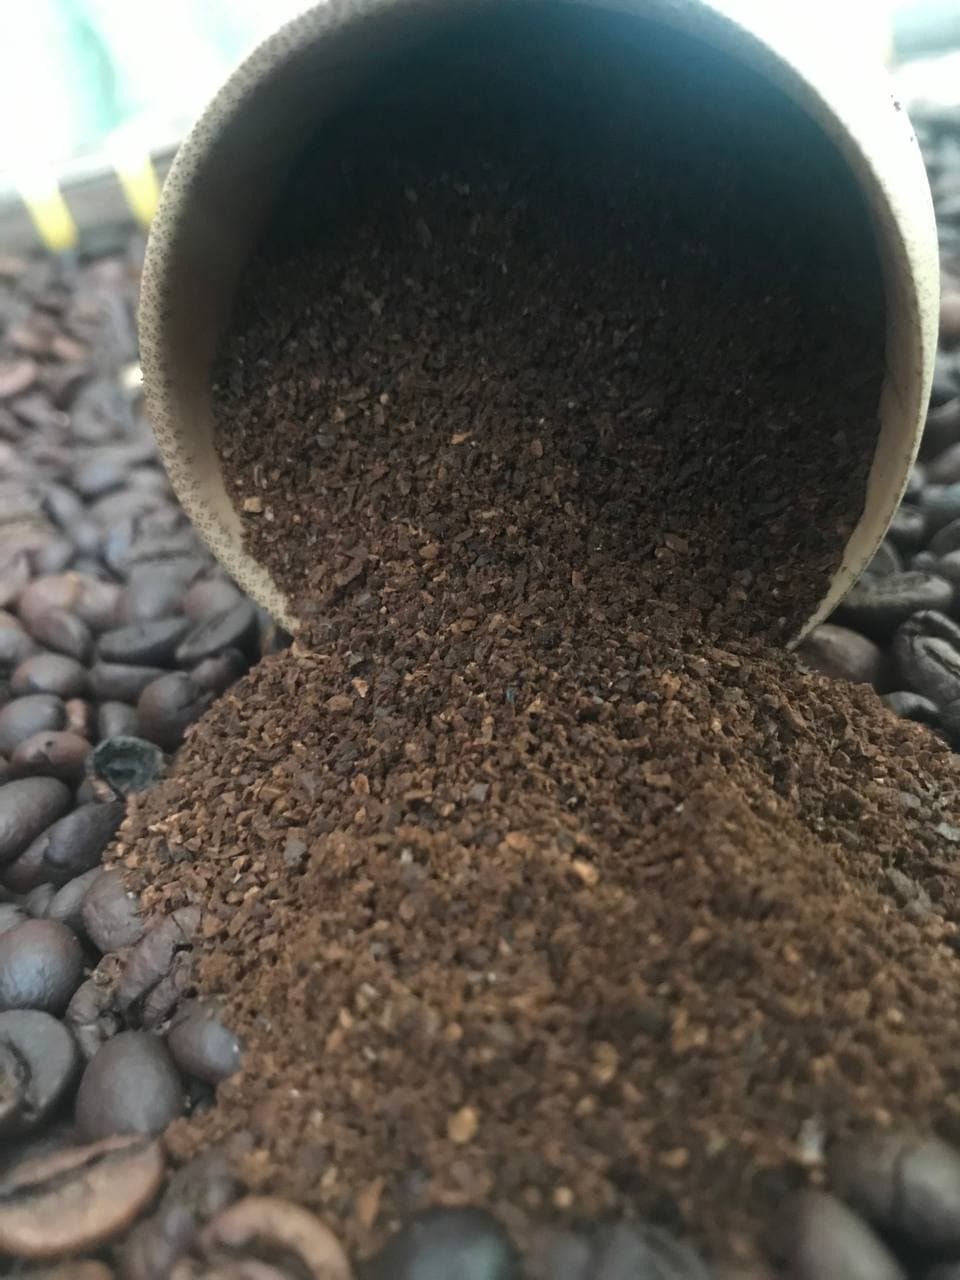
Tail distribution là gì
Tail distribution là phần của đường phân bố nằm ở hai đầu, tương ứng với các hạt có kích thước nhỏ hơn hoặc lớn hơn đáng kể so với phần lớn khối lượng mẫu. Đuôi mịn (fines) và đuôi thô (boulders) đều thuộc nhóm này, dù chúng thường chỉ chiếm một tỷ lệ nhỏ về khối lượng so với phần trung tâm của phân bố.
Vì sao phần fines đáng chú ý
Nghiên cứu của Smrke, Eiermann và Yeretzian về vai trò của hạt mịn trong động học chiết xuất espresso cho thấy tỷ lệ hạt rất mịn có thể ảnh hưởng đáng kể đến quá trình chiết xuất, dù về khối lượng chúng chỉ là một phần nhỏ của mẫu. Cơ chế được đề xuất liên quan đến việc hạt mịn có diện tích bề mặt lớn trên một đơn vị khối lượng và có thể làm thay đổi cách nước di chuyển qua lớp bột.
Cách đọc tail khi X50 gần nhau
Khi so sánh hai mẫu có kích thước trung vị gần như nhau, việc nhìn vào phần đuôi phân bố có thể giúp phát hiện khác biệt mà chỉ số trung vị bỏ sót. Một mẫu có đuôi mịn dày hơn, dù X50 tương đương, có thể tạo ra tốc độ chảy hoặc hiệu suất chiết xuất khác so với mẫu có đuôi mịn mỏng hơn.
Nguyên liệu cũng có thể làm tail thay đổi
Nghiên cứu về ảnh hưởng của nguồn gốc hạt và nhiệt độ đến quá trình xay cà phê rang cho thấy đặc tính của hạt trước khi xay, như độ giòn liên quan đến mức rang hoặc nhiệt độ hạt tại thời điểm xay, có thể ảnh hưởng đến hình dạng phân bố kích thước tạo ra, bao gồm cả phần đuôi. Điều này có nghĩa một thay đổi ở phần tail không nhất thiết luôn xuất phát từ cối xay.
PSD không tự dự đoán cảm quan
Một phân bố kích thước hạt, kể cả khi đã phân tích chi tiết phần đuôi, vẫn chỉ là dữ liệu vật lý về kích thước. Nó không tự động cho biết tách cà phê pha ra sẽ được người uống đánh giá thế nào. Muốn biết điều đó, vẫn cần thêm dữ liệu về hiệu suất chiết xuất và, nếu cần, đánh giá cảm quan trực tiếp.
Dùng tail để theo dõi tính nhất quán
Trong vận hành hằng ngày, theo dõi phần đuôi phân bố qua các lần đo có thể giúp phát hiện sớm dấu hiệu cối xay bắt đầu tạo ra nhiều hạt mịn hơn bình thường, chẳng hạn do lưỡi dao mòn hoặc điều chỉnh sai khe hở xay. Đây là cách dùng dữ liệu PSD mang tính thực tiễn cao, tập trung vào việc phát hiện thay đổi theo thời gian hơn là tìm một hình dạng phân bố lý tưởng tuyệt đối.
Kết luận thực hành
Đọc dữ liệu PSD chỉ qua kích thước trung vị có thể bỏ sót thông tin quan trọng nằm ở phần đuôi phân bố, đặc biệt là tỷ lệ hạt mịn. Theo dõi phần tail theo thời gian, đối chiếu với hiệu suất chiết xuất và đặc tính nguyên liệu, là cách tiếp cận thực tế hơn so với việc chỉ dựa vào một con số trung vị duy nhất.
Tài liệu tham khảo
- Smrke, S., Eiermann, A. & Yeretzian, C. (2024). The role of fines in espresso extraction dynamics. Scientific Reports, 14, 5612. DOI 10.1038/s41598-024-55831-x.
- Particle Size Distribution Model for Optimizing Coffee Grind Consistency (2025). Journal of Food Process Engineering, 48, e70129.
- Effect of particle size distribution on mass transfer during solid-fluid extraction and its application to coffee brewing (2025). Journal of Food Engineering, 394, 112511.
- The effect of bean origin and temperature on grinding roasted coffee (2016). Scientific Reports.
Particle-size-distribution (PSD) data from a grinder shouldn't be summarized by a single median value alone. The tail of the distribution — where very fine or very coarse particles sit — can carry important information about extraction performance that a single median number can't reveal.
PSD needs to be read as a distribution
A complete PSD result is a curve or table describing the mass or particle-count percentage at each size interval, not a single number. Two samples with the same median size (X50) can still have different distribution shapes, leading to different extraction behavior when brewed.
What tail distribution means
Tail distribution refers to the portions of the distribution curve at either end, corresponding to particles significantly smaller or larger than the bulk of the sample's mass. Both the fine tail (fines) and the coarse tail (boulders) belong to this group, even though they usually make up only a small proportion of the sample's mass compared with the central portion of the distribution.
Why the fines fraction deserves attention
Research by Smrke, Eiermann, and Yeretzian on the role of fine particles in espresso extraction dynamics found the proportion of very fine particles can significantly affect the extraction process, even though they make up only a small fraction of the sample by mass. The proposed mechanism relates to fine particles having a large surface area per unit mass and potentially altering how water moves through the coffee bed.
How to read the tail when X50 values are close
When comparing two samples with nearly identical median size, looking at the tail of the distribution can help reveal differences that the median index misses. A sample with a thicker fine tail, even with an equivalent X50, can produce a different flow rate or extraction efficiency than a sample with a thinner fine tail.
Raw material can also change the tail
Research on the effect of bean origin and temperature on grinding roasted coffee shows characteristics of the bean before grinding, such as brittleness related to roast level or bean temperature at the time of grinding, can affect the shape of the resulting particle-size distribution, including the tail. This means a change in the tail doesn't necessarily always originate from the grinder itself.
PSD doesn't automatically predict sensory outcome
A particle-size distribution, even when the tail has been analyzed in detail, is still just physical size data. It doesn't automatically tell you how a drinker will rate the resulting brewed cup. To know that, you still need additional data on extraction efficiency and, if needed, direct sensory evaluation.
Using the tail to track consistency
In daily operations, tracking the tail of the distribution across measurements can help detect early signs that a grinder is starting to produce more fine particles than usual, for example due to worn blades or an incorrectly adjusted grind gap. This is a highly practical use of PSD data, focused on detecting change over time rather than searching for one absolute ideal distribution shape.
Practical conclusion
Reading PSD data only through the median size can miss important information sitting in the tail of the distribution, especially the fine-particle ratio. Tracking the tail over time, cross-referenced with extraction efficiency and raw-material characteristics, is a more practical approach than relying on a single median number alone.
References
- Smrke, S., Eiermann, A. & Yeretzian, C. (2024). The role of fines in espresso extraction dynamics. Scientific Reports, 14, 5612. DOI 10.1038/s41598-024-55831-x.
- Particle Size Distribution Model for Optimizing Coffee Grind Consistency (2025). Journal of Food Process Engineering, 48, e70129.
- Effect of particle size distribution on mass transfer during solid-fluid extraction and its application to coffee brewing (2025). Journal of Food Engineering, 394, 112511.
- The effect of bean origin and temperature on grinding roasted coffee (2016). Scientific Reports.