
Khi một hạt lớn được phá thành nhiều hạt nhỏ, tổng diện tích bề mặt tiếp xúc với nước tăng. Điều này có thể làm thay đổi tốc độ hòa tan các chất trong cà phê. Tuy nhiên, kích thước trung vị không mô tả đầy đủ một mẻ xay. Nghiên cứu về espresso cho thấy hai mẫu có cùng kích thước trung vị vẫn có thể có tỷ lệ hạt rất mịn khác nhau và cho động học chiết xuất khác nhau.
Phân bố hạt và độ thấm của lớp cà phê
Lớp cà phê sau khi xay là một hệ hạt có khoảng rỗng giữa các mảnh. Hạt lớn tạo khoảng trống lớn hơn; hạt mịn có thể đi vào các khoảng đó và làm tăng sức cản dòng nước. Nghiên cứu Scientific Reports năm 2024 cho thấy khi tỷ lệ hạt mịn tăng, độ thấm của lớp cà phê giảm, tốc độ dòng giảm và thời gian chiết xuất tăng trong phạm vi thí nghiệm.
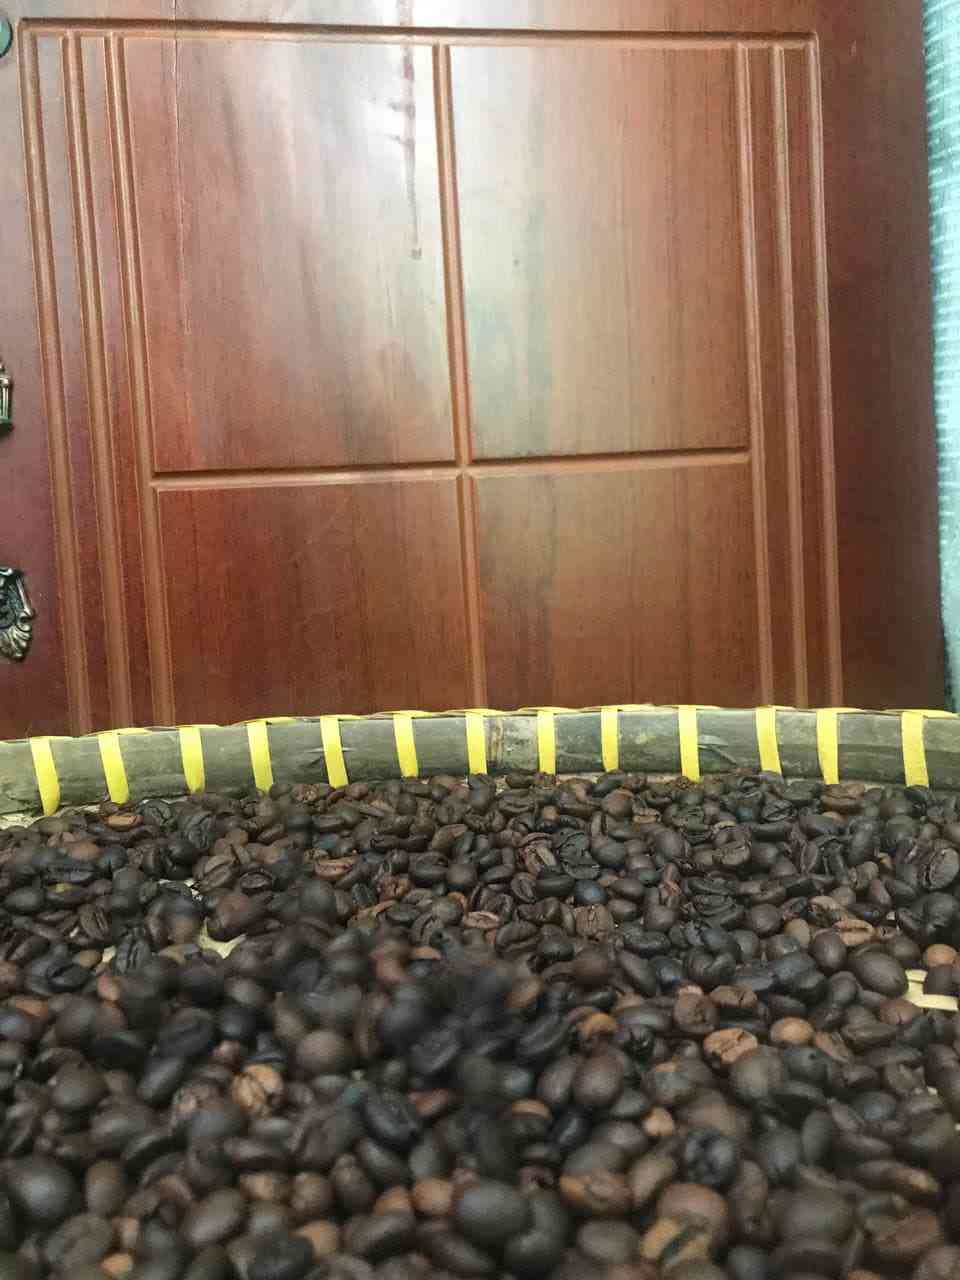
Cùng cỡ xay danh nghĩa vẫn có thể khác
Hai máy xay có thể được đặt ở cùng mức tương đối nhưng tạo ra phân bố khác vì hình học dao, khoảng cách dao, đặc tính hạt và điều kiện vận hành khác nhau. Vì vậy, mức chỉnh trên máy không phải là phép đo phân bố hạt. Nếu cần so sánh, phải xem dữ liệu kích thước và phần hạt mịn thay vì chỉ ghi lại vị trí núm chỉnh.
Tác động đến tốc độ và lượng chiết
Kích thước hạt ảnh hưởng cả tốc độ hòa tan và dòng nước qua lớp cà phê. Hạt nhỏ có thể được chiết nhanh hơn do diện tích bề mặt lớn, trong khi phần hạt mịn lại làm giảm độ thấm. Hai hiệu ứng có thể xảy ra đồng thời. Vì vậy, không nên kết luận rằng “hạt nhỏ luôn chiết nhanh” mà bỏ qua thay đổi của dòng chảy.
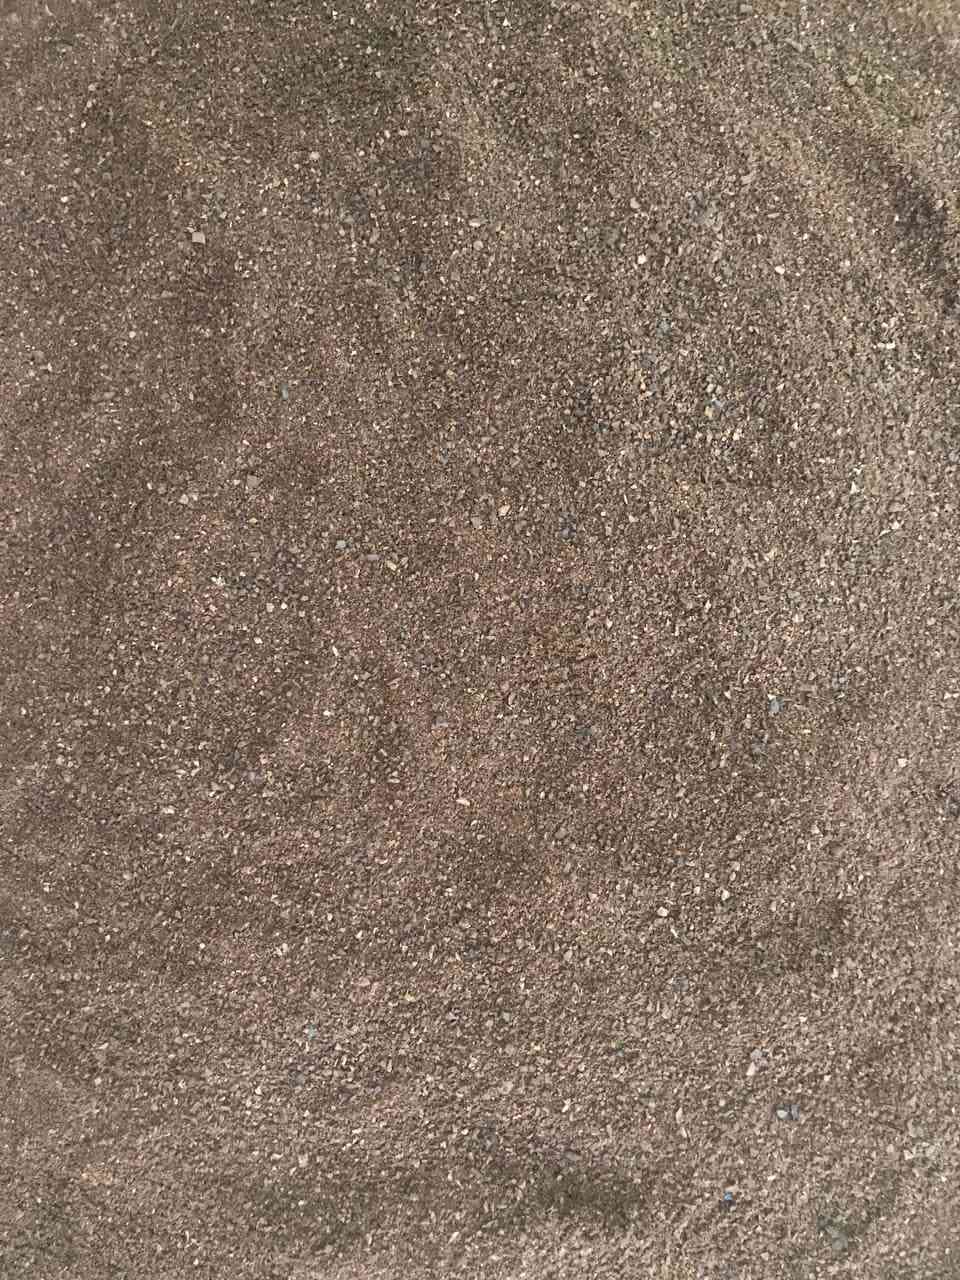
Cách đọc phân bố kích thước
Một biểu đồ phân bố cần được đọc bằng nhiều đặc trưng: kích thước trung vị, độ rộng phân bố và phần đuôi ở phía hạt rất nhỏ hoặc rất lớn. X50 có thể mô tả vị trí trung tâm, còn tỷ lệ dưới một ngưỡng cụ thể giúp nhận biết phần hạt mịn. Nghiên cứu về espresso sử dụng cả X50 và tỷ lệ hạt dưới 100 micromet để dự đoán thời gian chiết xuất.
Giới hạn của việc dùng một chỉ số
Không có một chỉ số đơn lẻ nào mô tả đầy đủ một mẻ xay. Hai phân bố có cùng X50 vẫn có thể khác độ rộng và phần đuôi. Ngược lại, cùng tỷ lệ hạt mịn chưa chắc có cùng hình dạng phân bố. Vì vậy, khi liên hệ phân bố hạt với chiết xuất, cần giữ đúng phạm vi của dữ liệu và tránh biến một chỉ số thành kết luận chung cho mọi phương pháp pha.
Dữ liệu PSD cần gắn với phương pháp đo
Kết quả phân bố phụ thuộc cách lấy mẫu và phương pháp đo. Khi so sánh hai mẻ, cần dùng cùng phương pháp và cùng cách biểu diễn. Nếu phương pháp khác nhau, một chênh lệch nhỏ trong biểu đồ chưa chắc phản ánh khác biệt thực sự của cà phê.
Hạt mịn và hạt lớn tạo tác động đồng thời
Hạt lớn thường tạo đường đi rộng hơn cho nước, trong khi hạt mịn có thể lấp khoảng trống và tăng sức cản. Cùng lúc, hạt nhỏ có diện tích bề mặt lớn hơn. Hai tác động này có thể kéo theo những hướng khác nhau, khiến quan hệ giữa PSD và chiết xuất không thể giản lược thành “càng nhỏ càng tốt”.
Độ rộng phân bố cũng quan trọng
Hai mẻ có cùng kích thước trung vị nhưng một mẻ có phân bố hẹp và một mẻ có đuôi hạt mịn dài sẽ tạo lớp hạt khác nhau. Độ rộng phân bố giúp nhận biết mức độ không đồng đều của các mảnh sau xay. Vì vậy, đánh giá PSD nên nhìn cả vị trí trung tâm và hình dạng phân bố.
Góc nhìn bổ sung
Một biểu đồ PSD cần được đọc như một cấu trúcKhi nhìn biểu đồ phân bố kích thước, phần trung tâm cho biết vùng kích thước chiếm tỷ trọng lớn, trong khi độ rộng và các đuôi cho biết mức độ phân tán. Một mẻ có đuôi hạt mịn dài có thể có hành vi khác mẻ có trung vị tương tự nhưng phân bố hẹp hơn. Nghiên cứu Scientific Reports sử dụng X50 cùng tỷ lệ hạt dưới 100 micromet để mô tả tác động đến thời gian chiết xuất. Đây là ví dụ cho cách dùng nhiều đặc trưng thay vì một con số. Khi áp dụng vào dữ liệu thực tế, điều quan trọng là giữ nhất quán phương pháp đo, cách lấy mẫu và điều kiện thử. Nếu các điều kiện này thay đổi, khác biệt trên biểu đồ có thể đến từ phương pháp đo chứ không phải từ bộ dao hoặc cà phê.
Điểm cần lưu ý
Nếu mục tiêu là so sánh hai mẻ xay, nên ghi cả điều kiện đo và dữ liệu phân bố. Chỉ nói “mẻ A mịn hơn mẻ B” không cho biết phần nào của phân bố đã thay đổi. Một mẻ có thể tăng hạt mịn nhưng giữ nguyên vùng trung tâm; một mẻ khác có thể dịch toàn bộ phân bố về kích thước nhỏ hơn. Hai trường hợp này có ý nghĩa vật lý khác nhau.
Một lớp dữ liệu bổ sung
Một phân bố rộng cũng có nghĩa các hạt có thể trải qua điều kiện chiết xuất khác nhau trong cùng một lớp. Hạt nhỏ có thể được chiết nhanh hơn, trong khi hạt lớn cần thời gian dài hơn. Nếu phân bố quá rộng, kết quả tổng thể là sự kết hợp của nhiều tốc độ hòa tan chứ không phải một tốc độ duy nhất.
Particle size distribution, often abbreviated PSD, describes how much coffee exists at different particle sizes after grinding. It matters because particle size changes available surface area while the overall distribution changes the pore structure and permeability of the coffee bed. These two effects can occur at the same time, which is why extraction cannot be reduced to the rule that smaller particles simply extract faster.
Particle Size and Available Surface Area
When a roasted coffee bean is broken into smaller pieces, the total surface area available for contact with water increases. This can influence the rate at which soluble material becomes accessible during brewing. However, the median particle size does not describe the whole sample.
Two coffees can have a similar median while containing different amounts of very fine or very large material. Their extraction behavior can therefore differ even though a single summary number suggests similarity. For this reason, PSD should be understood as a distribution rather than a single grind-size label.
Distribution and Bed Permeability
Ground coffee forms a porous bed with spaces between particles. Larger particles tend to create larger voids, while fine particles can occupy some of those spaces and increase resistance to water movement. Research published in Scientific Reports has shown that increasing the proportion of very fine particles can reduce permeability, decrease flow, and increase extraction time within the tested espresso conditions.
This is an important physical mechanism because it means that particle distribution affects not only how much surface is available, but also how water travels through the bed. The two effects can oppose one another. Smaller particles may be more readily accessed by water, while an excess of fines can restrict the flow through the overall bed.
Why the Same Nominal Setting Can Differ
Two grinders can be placed at similar relative settings and still produce different PSDs. Burr geometry, burr spacing, alignment, wear, rotation speed, coffee characteristics, and operating conditions all influence the fracture process. Therefore, a grinder setting is not a direct measurement of PSD.
If two batches need to be compared, the useful evidence is the measured distribution and the measurement method, not simply the position of the grinder dial. The same principle applies over time. A grinder can produce a different distribution after burr wear or a change in the coffee even when the nominal setting has not moved.
Effects on Flow and Extraction
Particle size can influence both dissolution and water flow. Smaller particles generally provide more surface area, while fine material can increase resistance to flow. These effects happen together, so the overall result depends on the distribution and the brewing system.
This is why the statement “smaller particles extract faster” is incomplete. It describes one aspect of the system but ignores permeability. A bed containing many fines may restrict water movement and change contact time, pressure distribution, and extraction dynamics.
In espresso, studies have used particle-size characteristics such as median size and the fraction below a defined threshold to help explain variation in extraction time. The exact relationship should remain tied to the experimental conditions rather than being generalized to every brewing method.
How to Read a Particle-Size Distribution
A useful PSD description includes more than the center of the distribution. X50, for example, can describe a median-type position, while the width of the distribution and the tails reveal how widely the particles are spread. The fine-particle tail can be especially informative in espresso because a relatively small mass fraction of very fine particles may have a disproportionate effect on permeability.
At the same time, the large-particle tail can indicate how much coarse material remains that may behave differently during extraction. A graph should therefore be read as a structure. The center tells you where much of the material sits; the width and tails tell you how heterogeneous the sample is.
Why One Number Is Not Enough
Two distributions can have the same X50 and still differ greatly in width or fine-particle content. Conversely, two distributions can contain a similar fraction of fines while having different centers and shapes. This is why a single grind-size number is rarely enough to explain a brewing result.
It can be a useful summary, but it should not be mistaken for the complete physical description of the coffee bed. Measurement method matters too. Sampling, sieving, imaging, and other analytical approaches can produce different representations.
Comparisons are most meaningful when the same method, sampling procedure, and reporting convention are used.
Connecting PSD Data to a Brewing Method
PSD becomes useful when connected to the conditions in which the coffee is actually extracted. Espresso involves pressure and a relatively compact bed. Other methods involve different flow patterns, contact times, agitation, and water-to-coffee relationships.
A distribution that behaves one way in espresso cannot automatically be assigned the same extraction meaning in immersion or filter brewing. The correct interpretation depends on the physical system being studied. A practical PSD record can therefore include grinder, burr condition, coffee identity, sample method, X50 or other central descriptors, distribution width, and fine-particle fraction.
These measurements can then be compared with brew time, flow, TDS, extraction yield, and sensory results when those data are available. The key idea is that PSD connects grinding to extraction through two major pathways: material accessibility and water movement. Understanding both prevents overly simple conclusions and gives the roaster or brewer a better basis for diagnosing why two coffees ground to a similar nominal size can behave differently in the cup.
For comparison work, consistency in sampling is just as important as the PSD metric itself. A distribution measured from one portion of a grind can differ from another if the sample is not representative. The same analytical method should therefore be used when comparing batches, with the same reporting conventions and, where possible, the same sampling procedure.
Once those controls are in place, PSD can become a useful bridge between grinder performance and brewing data. It does not replace brew measurements or sensory evaluation, but it can help explain why changes in flow and extraction appear after the grinder output changes.